Exact Path Proficiency Amplifies the Positive Impact of Exact Path Growth
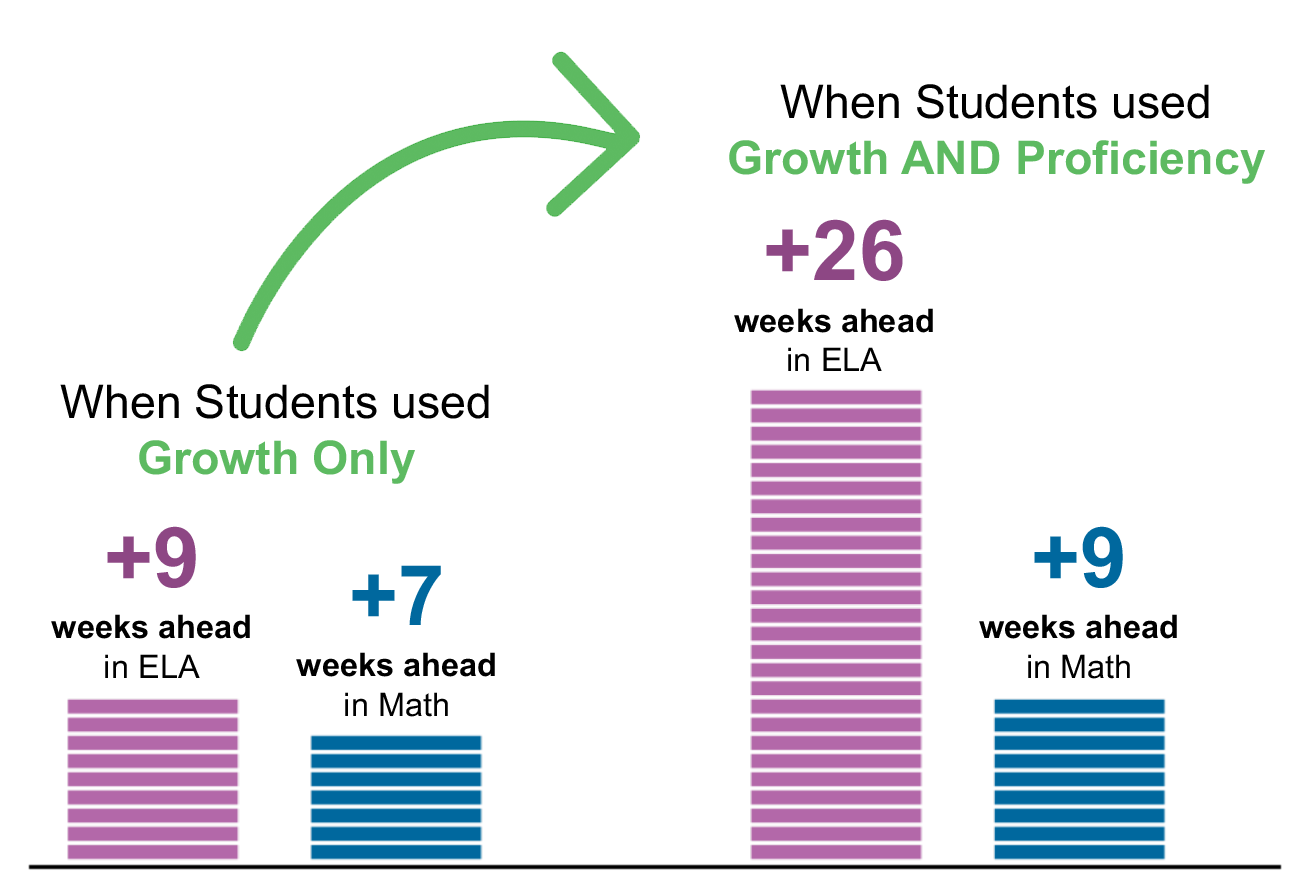
Students who used both Exact Path Proficiency and Growth improved the most on state math and ELA assessments
What did we find?
We examined 6th-8th grade state assessment results from over 6,000 math students and over 8,000 ELA students in a large district in Florida and compared growth between students who used Exact Path Growth and Proficiency and similar students who did not.
A formula for stronger gains
This research adds to the consistent findings showing that students who use Exact Path Growth learn more than similar students in the same district starting at similar places.
It also provides important new evidence that this positive impact has not reached its limit – that students can benefit even more when they pair personalized instruction tailored to their current needs with focused practice on grade-level standards-aligned content.
Proficiency amplifies growth
Students who used both Exact Path Growth and Proficiency saw the greatest improvements on state math and ELA assessments. Together, these programs created a powerful boost to student learning.

The quasi-experimental efficacy study meets the What Works Clearinghouse (WWC) 5.0 standards with reservations and ESSA criteria for moderate evidence (Tier 2).

The program behind the results
Learn more about Exact Path, the program used in this study, and explore additional research on how it supports student growth and proficiency.
Ready to get started?
1 To calculate the number of additional weeks needed by non-users to match those using Exact Path Growth and Proficiency, we obtained the grade- and subject-specific mean scaled scores of the fall (PM1) and spring (PM3) results in recently released FAST results. For each subject, we took the difference between spring and fall and averaged these differences using weights equal to the proportion of students in each grade in the analytical sample. We then took these differences and divided by the typical number of weeks between these test administrations (36), to get the weekly growth rates. Last, we took the estimated mean difference in test scores for each group in the analysis, subtracted its fall average test score, and divided by these weekly rates.
2 See Tables 8 and 9 in the full report.
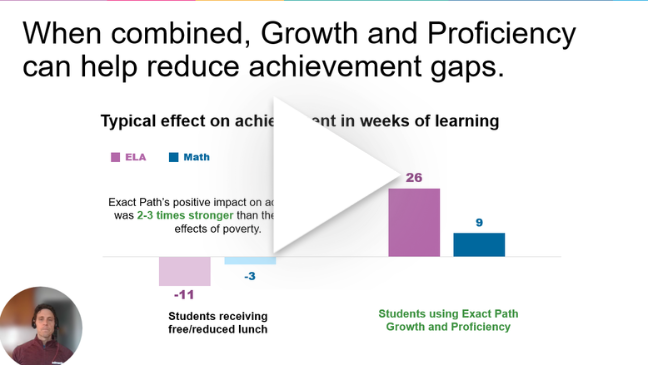
3 Experiencing poverty defined as receiving free/reduced lunch. See Tables A1 and A2 in the full report.