


2025–26 Annual Edmentum Impact Report


As a state or district leader, your decisions shape your students’ ability to catch up, graduate on time, stay engaged, and prepare for the future. This report provides a clear picture of Edmentum’s impact on these priorities, presenting the research behind each finding and the strength of the evidence behind every claim.
What’s inside: 36 studies and 10 district stories*
Flagship Study
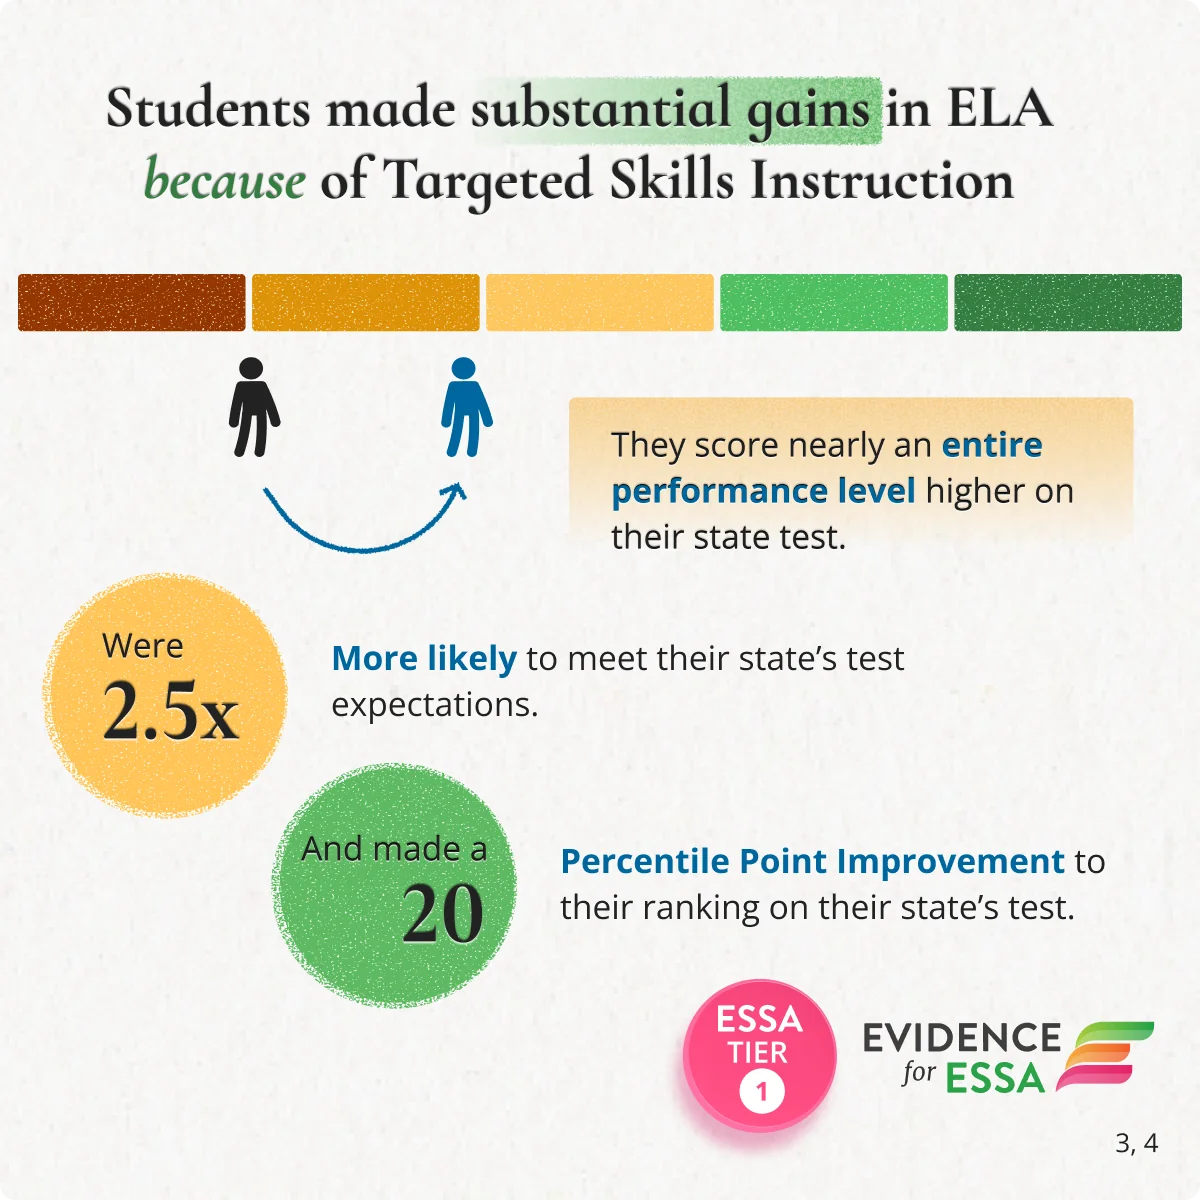
Students made substantial gains in ELA because of Targeted Skills Instruction

Students were 2.5x
more likely to meet their state’s test expectations.1

* The number of studies reflects all studies cited in this report. Studies reported in more than one chapter are counted once.
1 Third-party validated study of Targeted Skills Instruction, large New Jersey district, 2,000+ students in grades 3, 4, and 6 who began the year below grade level. Regression discontinuity design. Meets ESSA Tier 1 and What Works Clearinghouse 5.0 standards without reservations. The causal estimate applies to students near the district's 25th-percentile eligibility cutoff, not to every student who received tutoring. https://www.edmentum.com/impact/efficacy-research/targeted-skills-instruction-substantially-improves-reading-achievement/
Real schools. Human stories. Powerful student outcomes.


This isn't our impact report.
It's yours. It's your story. It's the students' lives that you touch.”

Our reach this year


2 Students reflect client individuals who launched content in an Edmentum product during Edmentum's 2026 fiscal year (February 1–January 31). Districts and organizations reflect publicly funded school districts, additional publicly funded entities, and non-public and partner districts served in the same period. Source: Edmentum Business Systems.
How Edmentum helps K–12 leaders solve today's four biggest challenges

Every school year, you’re tasked with improving academic performance across K-12, keeping students on track to graduate, building stronger connections, and preparing students for life after high school. And you need to do all of it with the staff and funding you have.
Four challenges. Four chapters of evidence.
Each chapter shows what the evidence says, and how strong that evidence is.
Working on one of these challenges right now?
Connect with our team to see how research-backed solutions fit your district’s plan.


Academic Acceleration
The Challenge
You’re setting measurable proficiency goals and framing the work as acceleration rather than remediation. The vocabulary has shifted, and the work beneath it is harder than the language suggests: identifying where each student actually is, addressing gaps, and keeping students moving toward grade-level expectations at the same time.

How Edmentum helps K-12 leaders move students forward, not just catch them up
Students don’t all start in the same place, so acceleration starts with precise knowledge of where each student is. That knowledge only matters if it changes what happens next: personalized instruction targeting specific skill gaps, grade-level standards, or live, educator-led tutoring for students who need more intensive support. You shouldn't have to choose between addressing unfinished learning and keeping students connected to grade-level work.
Causal | Strong Evidence

Targeted Skills Instruction improved students’ reading achievement
This year, Edmentum met the highest bar in education research for the first time. An evaluation of Targeted Skills Instruction, our high-impact tutoring program, met the ESSA Tier 1 standard for strong evidence and the What Works Clearinghouse 5.0 standards without reservations.3 In a large New Jersey district, students scoring at or below the 25th percentile were selected for tutoring. Among students near that cutoff, those who received Targeted Skills Instruction improved because of it, gaining an average of 16.79 points on the state ELA assessment. That moved them roughly 20 percentile points ahead in reading.4
3 Third-party validated study of Targeted Skills Instruction, large New Jersey district, 2,000+ students in grades 3, 4, and 6 who began the year below grade level. Regression discontinuity design. Meets ESSA Tier 1 and What Works Clearinghouse 5.0 standards without reservations. The causal estimate applies to students near the district's 25th-percentile eligibility cutoff, not to every student who received tutoring. https://www.edmentum.com/impact/efficacy-research/targeted-skills-instruction-substantially-improves-reading-achievement/
4 “Nearly 1 performance level higher” based on RDD model-based mean difference estimated right at the cut score. This difference was 16.79, and the performance level in which most of these students (“Partially Met”) were estimated to place had a width of 25. https://www.edmentum.com/impact/efficacy-research/targeted-skills-instruction-substantially-improves-reading-achievement/
Psychometric | Assessment Quality

Exact Path predicts how students will perform on the tests to which districts are held
Exact Path Insights assessments predict student performance on 28 state summative assessments, as well as the ACT®, SAT®, and PSAT®, at levels exceeding the National Center on Intensive Intervention (NCII) strong correlation threshold. Exact Path identifies student needs regardless of gender, ethnicity, disability, economic status, or multilingual learner classification.5
- AL: 0.79
- AR: 0.76
- AZ: 0.79
- CA (SBAC (8 states)): 0.76
- FL: 0.77
- IA: 0.79
- IN: 0.83
- KY: 0.78
- LA: 0.82
- MT: 0.83
- NC: 0.82
- NH: 0.85
- NJ: 0.84
- OH: 0.83
- OK: 0.75
- PA: 0.82
- SC: 0.76
- TN: 0.80
- TX: 0.78
- VA: 0.83
- WI: 0.82
- ACT: 0.86
- PSAT: 0.78
- SAT: 0.77
NCII strong correlation threshold
- AL: 0.79
- AR: 0.76
- AZ: 0.79
- CA (SBAC (8 states)): 0.76
- FL: 0.77
- IA: 0.79
- IN: 0.83
- KY: 0.78
- LA: 0.82
- MT: 0.83
- NC: 0.82
- NH: 0.85
- NJ: 0.84
- OH: 0.83
- OK: 0.75
- PA: 0.82
- SC: 0.76
- TN: 0.80
- TX: 0.78
- VA: 0.83
- WI: 0.82
- ACT: 0.86
- PSAT: 0.78
- SAT: 0.77
5 Correlation thresholds reflect National Center on Intensive Intervention technical review standards, where 0.7 or above is rated strong. Predictive validity was established through linking studies conducted by Edmentum Psychometric Research and third-party researchers. https://www.edmentum.com/impact/psychometric-research/

Flexible Pathways to On-Time Graduation
The Challenge
High school isn’t a straight line to graduation, and for some students, one wrong turn closes the path entirely. A failed course in the fall can put a diploma out of reach by senior year, and the students who fall behind are rarely behind by a single credit. You need ways to keep students on track, recover lost ground, and expand access to coursework when schedule, staffing, or location make the traditional path difficult.

How Edmentum helps K-12 leaders keep graduation within reach, without lowering the bar
When students fall behind, flexibility can create another path forward. But a more flexible way to earn credit only makes a true difference when students have mastered the content behind it, which is why we treat access, progress, and trust as a single design problem rather than three.
Correlational | Promising Evidence

More success for students who need to recover multiple credits
Independent researchers at Empirical Education examined more than 10,000 credit-recovery course enrollments in Baltimore City Public Schools during summer 2024. The average student took three summer courses, so the question wasn’t whether one course worked; it was whether a heavy recovery load could hold. As course load increased, success rates in traditional-only schedules fell from 82% for one course to 39% for five, while an even mix that included Courseware held far steadier, from 75% to 65%.6

- 1 Summer Course*: Traditional only 82%, Courseware included 75%
- 2 Summer Courses: Traditional only 71%, Courseware included 78%
- 3 Summer Courses: Traditional only 61%, Courseware included 74%
- 4 Summer Courses: Traditional only 50%, Courseware included 70%
- 5 Summer Courses: Traditional only 39%, Courseware included 65%
Note: * For 1 course, success rate is raw percent of students passing either an in-person or Courseware course. For all other results, success rates estimated from a logistic regression model controlling for race/ethnicity, prior GPA, and other student characteristics. Probabilities estimated for Black female students with a prior GPA of 1.9 and a prior course completion rate of 50%. Model estimates used because of small sample sizes for some combinations and to account for differences between students, though results based on raw percentages were qualitatively similar.
66 Independent case study conducted by Empirical Education. More than 10,000 credit-recovery course enrollments, Baltimore City Public Schools, summer 2024. Course-level analysis used a matched comparison design with propensity score matching, consistent with What Works Clearinghouse standards with reservations; student-level course-load analysis is correlational. Findings constitute ESSA Tier 3, promising evidence. https://www.edmentum.com/impact/efficacy-research/courseware-helped-students-recover-more-credits-in-baltimore
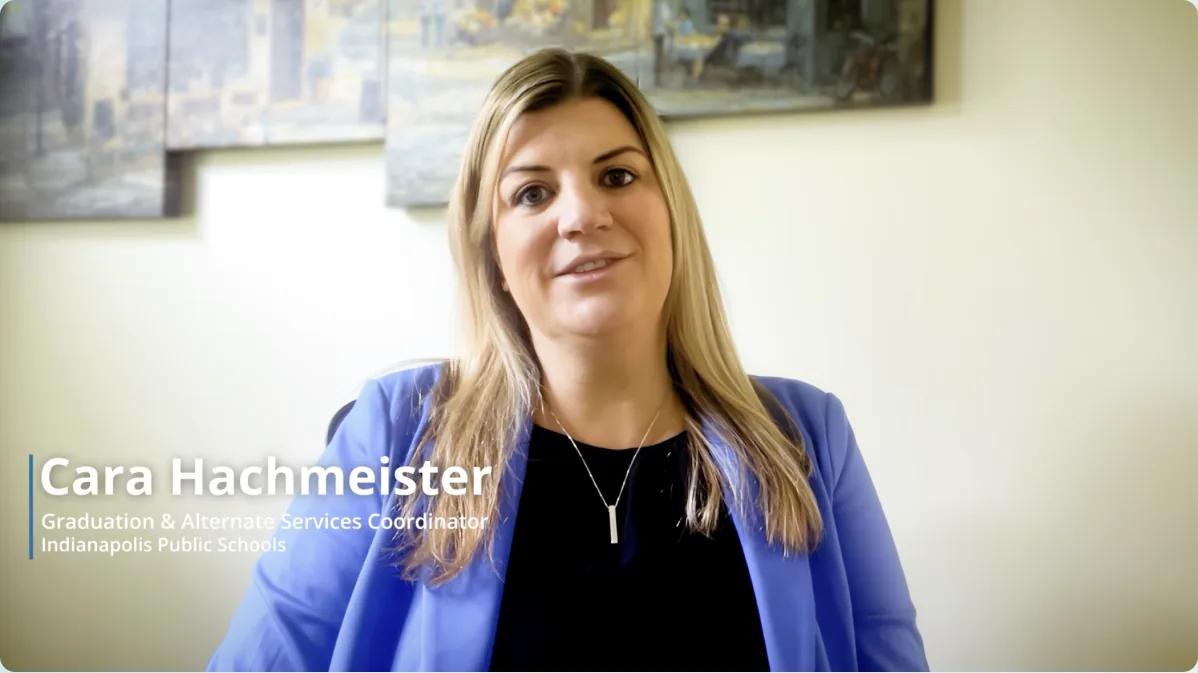

Indianapolis Public Schools graduation rate rose from 79% to 95%
Customer-Reported | District-Measured Outcomes

Indianapolis Public Schools rebuilt credit recovery around mastery, not seat time
Before Courseware, an IPS student who failed a class could be required to repeat a full 18-week semester. The district customized courses to its own curriculum maps, so recovery focused on the content a student still needed to master, while keeping classroom-level expectations and academic integrity standards in place. IPS reports its graduation rate rose from 79% to 95%, with more students graduating on time.7
7 Outcomes reported by Indianapolis Public Schools. Edmentum does not independently verify district-reported data and does not attribute district outcomes to a single product.
https://www.edmentum.com/impact/success-stories/indianapolis-public-schools-mastery-based-credit-recovery

Attendance and Re-engagement
The Challenge
Attendance is likely near the top of your list, and many districts are setting ambitious targets for cutting chronic absenteeism. Educators are putting in real work to bring students back. Showing up doesn’t guarantee a student stays connected to their coursework, though. When that connection breaks, the cost shows up as incomplete courses and missing credits, putting a diploma at risk.

How Edmentum helps K-12 leaders bring students back to authentic learning, not just to a seat
Re-engagement starts by giving students realistic ways to stay connected to school, not just reasons to return to a seat. Edmentum helps districts create more flexible ways for students to continue learning while keeping educators and support around them.
Correlational | Promising Evidence
A flexible option that didn't lower the bar
Re-engagement only counts if it ends in meaningful credit.
In the same Baltimore analysis from Chapter 2, students using Courseware were no more likely to complete an individual course than similar peers in traditional sections, with results varying by subject and grade level.8 The option served a comparable mix of students on GPA, grade level, gender, and special education status.8
- Traditional only, four traditional in-person classes: 2.0 credits recovered
- Even mix, two traditional and two Courseware classes: 2.8 credits recovered, nearly one additional credit
8 Independent study conducted by Empirical Education, Effectiveness of Edmentum Courseware in High School Credit Recovery (April 2026). More than 10,000 credit-recovery course enrollments, Baltimore City Public Schools, summer 2024. Course-level analysis used a matched comparison design with propensity score matching, consistent with What Works Clearinghouse standards with reservations; student-level course-load analysis is correlational. Findings constitute ESSA Tier 3, evidence of promise. The study only counted successful completion of a Courseware course if a student earned a grade above 60% based on their lesson and unit activities and scores, or scored above 70% on the end of course test. It did not allow for any overrides of those criteria to be considered successful completion. On individual course completion, Courseware's estimated average effect was −7.1 percentage points, with negative effects in core subjects, positive effects in electives, foreign language, and health, and a positive effect for 12th-grade students. The report notes that Courseware and district grades are not necessarily equivalent measures, since Courseware grades map directly from earned points while district grading may incorporate attendance or participation, and that grade-based comparisons may therefore understate Courseware students' performance. https://www.edmentum.com/impact/efficacy-research/courseware-helped-students-recover-more-credits-in-baltimore
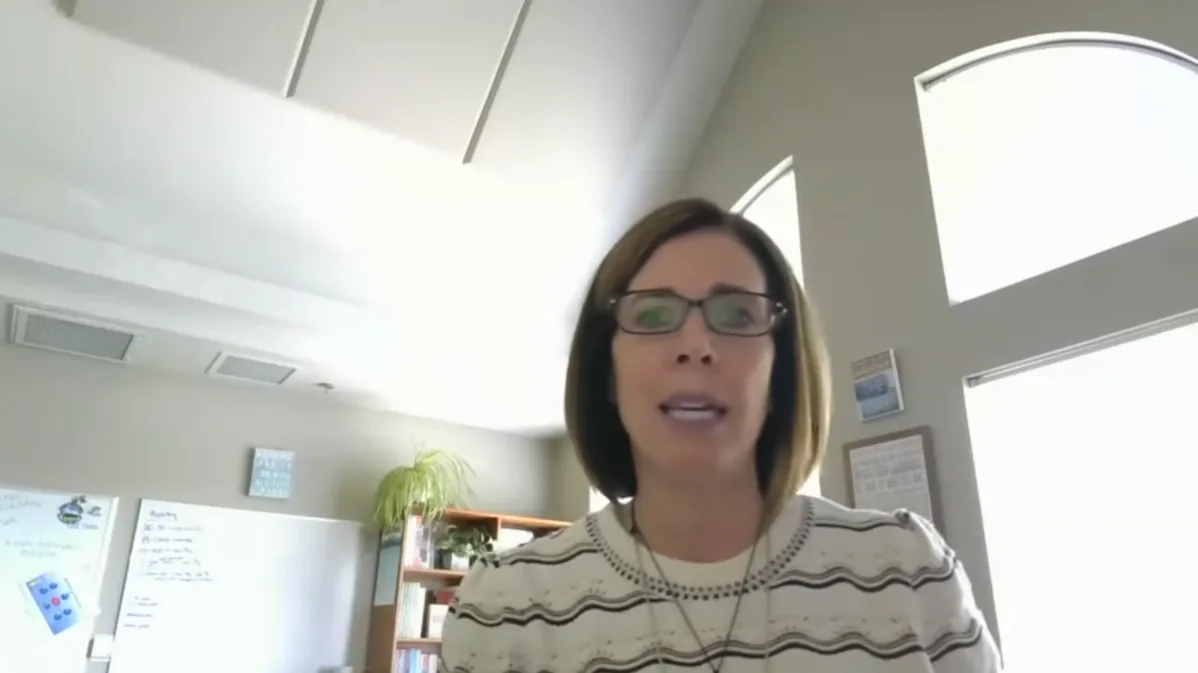
93% Pass Rate
Customer-Reported | District-Measured Outcomes
Sumner-Bonney Lake built a virtual program for students who had already disengaged
Students entered Sumner-Bonney Lake’s Alternative Learning Experience program after anxiety, depression, or medical challenges pulled them out of a traditional setting. The program serves more than 1,000 students across credit recovery, hybrid, and fully online learning, with courses customized to support language and special education needs. The district reports a 93% pass rate across all three programs.9
9 Outcomes reported by Sumner-Bonney Lake School District, Washington. 93% pass rate across credit recovery, hybrid, and fully online programs serving more than 1,000 students. Edmentum does not independently verify district-reported data and does not attribute district outcomes to a single product. https://www.edmentum.com/resources/webinars/virtual-learning-best-practices-how-wa-district-93pct-passing-rate/

Future
Readiness
The Challenge
You’re redefining graduation success beyond the diploma, setting goals around credentials and career or college readiness. But a goal is only the starting point. What’s often missing is the connective tissue that spans the K-12 experience, connecting exploration, course selection, and real-world work experience into something a student can actually walk through.

How Edmentum helps K-12 leaders build a path from exploration to readiness
Exposure starts as early as elementary school, when a student discovers an interest, builds into a course plan in middle and high school, and gets tested with work-based learning and certification preparation. You may already have the pieces. Edmentum connects the system.
Descriptive | Observed Patterns

Online CTE expanded access into pathways and completion at the finish line
In a separate Baltimore study, Edmentum’s research team examined all 6,911 CTE students in grades 9–12 during 2023–24. Online enrollment added 59% more students to the 9th-grade CTE count and 60% more to the 12th-grade count than what in-person enrollment alone accounted for.10 And students didn’t compromise on rigor: performance in Courseware CTE courses was statistically similar to equivalent traditional courses.10
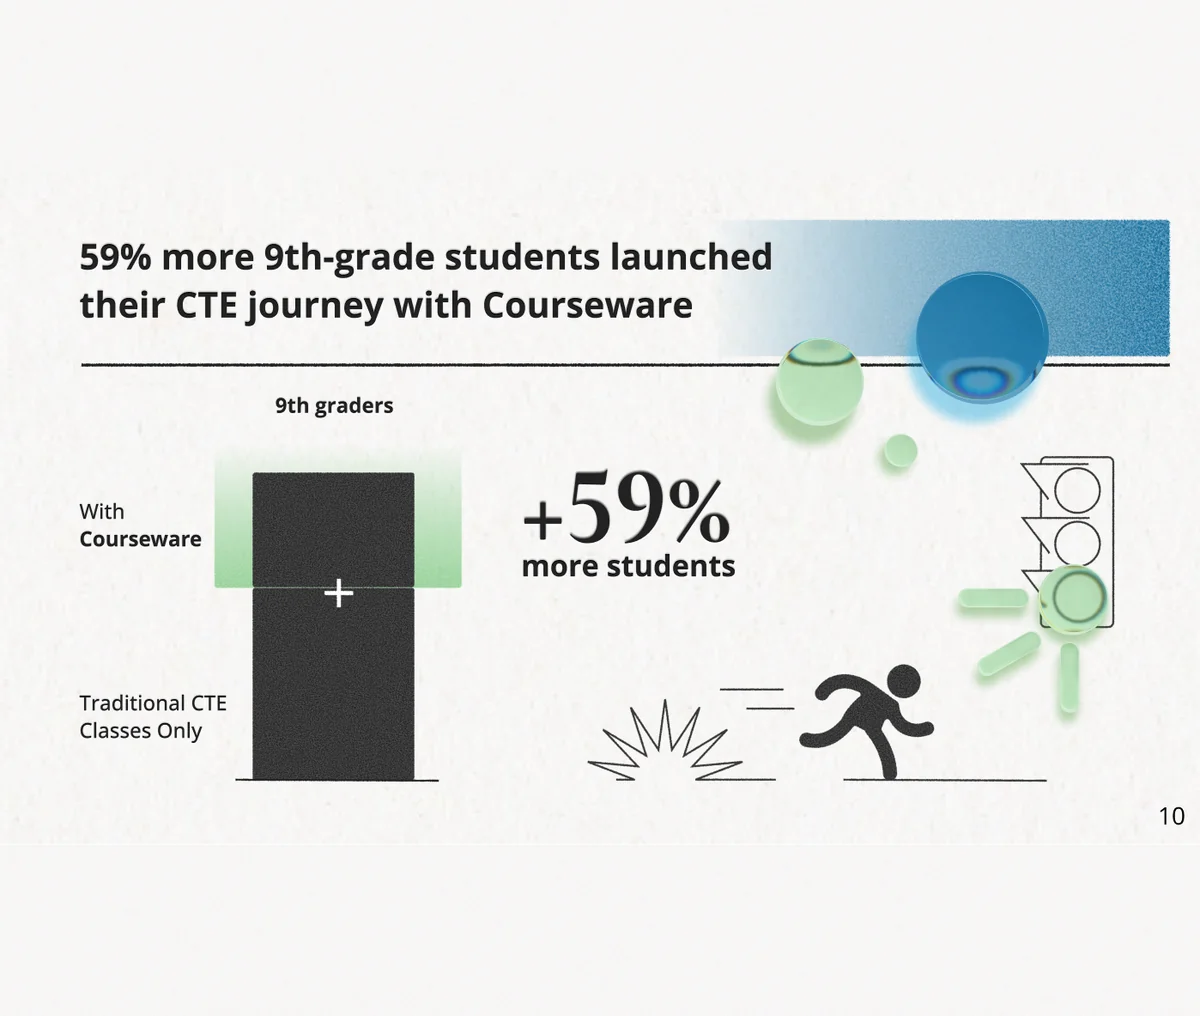
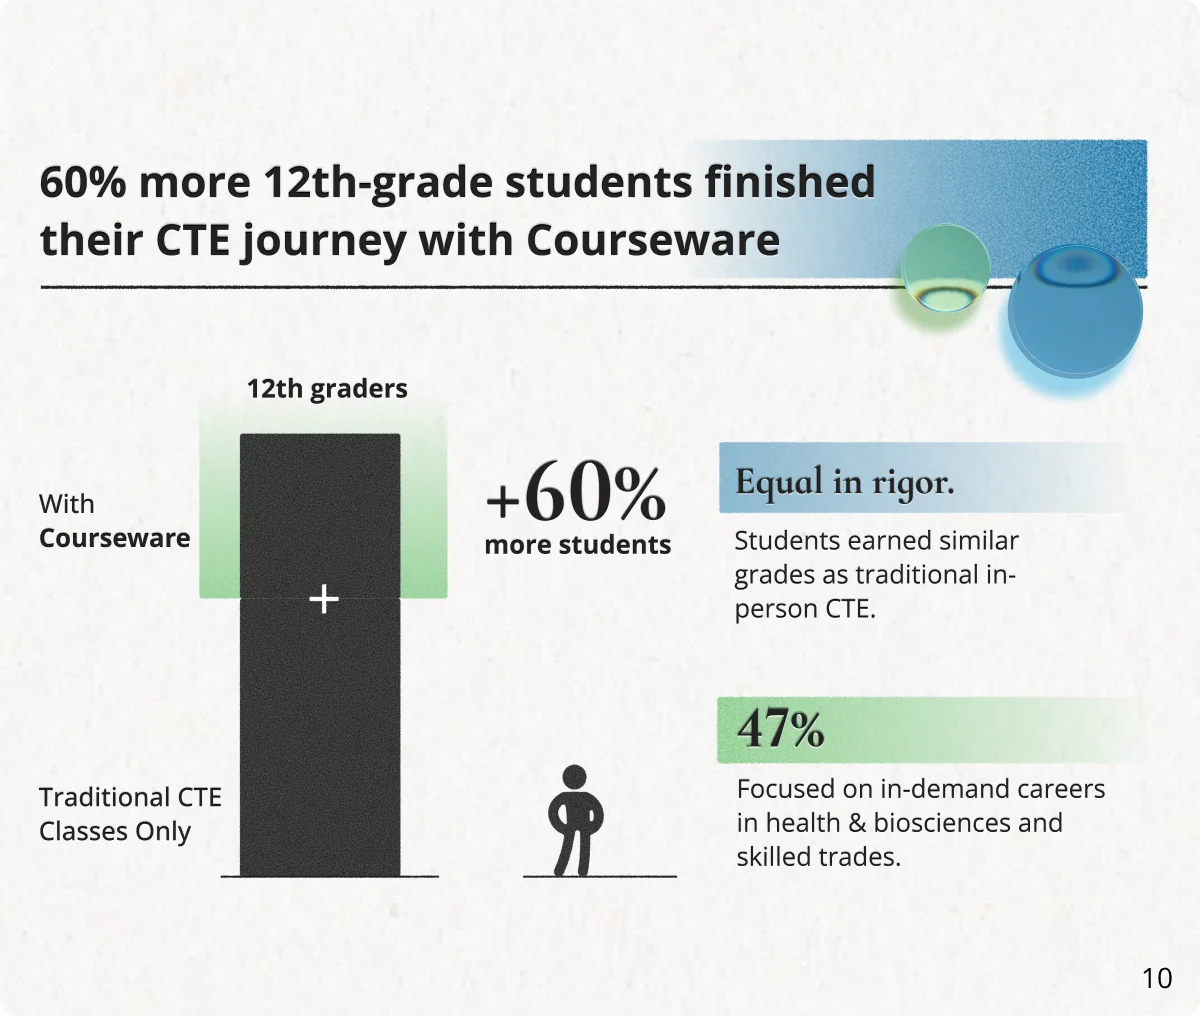
10 Descriptive analysis by Edmentum Efficacy Research and Learning Engineering, using student-level administrative data from Baltimore City Public Schools. All 6,911 CTE students in grades 9–12, 2023–24. The 59% and 60% figures express online CTE enrollment at those grades as a share of in-person enrollment at the same grade. They are counts, not growth, and not an effect of online delivery. Descriptive and observational; does not support causal inference. Single district, single school year. Not ESSA-rated. https://www.edmentum.com/impact/efficacy-research/courseware-is-a-key-part-of-cte-pathway-access-and-completion
- 2022–23: 26%
- 2023–24: 46%
- 2024–25: 79%
- 2025–26: 87%
Customer-Reported | District-Measured Outcomes
Rockingham County used student interest data to fund a new school
Rockingham County Schools in North Carolina deployed MajorClarity starting in sixth grade and tracked multi-year trends in students’ intended career paths. The district used that data to advocate for, fund, and open the CTE Innovative High School, focused on the high-demand pathways the data identified. Rockingham reports industry-recognized credential attainment rose from 26% to 87%.11
“MajorClarity has been very beneficial for us with serving our students and placing them in career pathways.”
11 Outcomes reported by Rockingham County Schools, North Carolina, covering 11 schools and 5,636 students in grades 6–12 served annually. Edmentum does not independently verify district-reported data and does not attribute district outcomes to a single product. https://www.edmentum.com/resources/webinars/how-this-district-used-data-build-the-cte-program-students-want
Our Approach | Stated Intent

Measurable outcomes are the standard
We study the efficacy of our programs against recognized bars for quality, we publish what we find including where the evidence is still developing, and we match our language to the strength of the evidence. That last commitment is what the labels throughout this report are for. Our products and research are reviewed and validated by reputable third parties. The full list of certifications lives with our commitments.
AI is changing what we can measure, and we’re studying how AI opens opportunities to evolve assessment design and practice:
- How we capture interests and durable skills in career-connected learning
- How assessments within credit recovery courses can transform to better support student outcomes with integrity
- How well screeners identify the students who need intervention most
Two studies are already scheduled:
- Additional validity and reliability studies of the literacy tasks for our next submission to the National Center on Intensive Intervention
- A progress-monitoring study to support submission to NCII’s Academic Progress Monitoring Tools list
Across all studies, we are committed to understanding not just what works and under which conditions, but also for whom, honoring the diverse learners, educators, and districts we serve.
Recognition for the company behind the report
The awards in each chapter recognize specific products. These recognize the company and its leadership.
-
Calibre One: Top 25 Women Leaders in PE-Backed Software, Jamie Candee
-
The Edtech Awards: Edmentum CEO Jamie Candee Named Global EdTech Leader of the Year
-
The Tech Edvocate Awards: finalist, Edmentum, Best Global EdTech Company
The Tech Edvocate Awards: finalist, CEO, Best Global EdTech Leader
What each kind of evidence can tell you
Not all evidence is the same. Here is what each kind of evidence in this report can and cannot tell you. This report labels every claim in it by the strength of the evidence behind it.
Causal | Strong Evidence
Research meeting Every Student Succeeds Act (ESSA) Tier 1 and What Works Clearinghouse (WWC) standards without reservations. It requires a study design that rules out other explanations for what happened. Strong evidence that the program improved outcomes.
What we can say: Students improved on the outcome measure as a result of the program.
Comparative | Moderate Evidence
Research meeting ESSA Tier 2, or WWC standards, with reservations. Students using the program are compared with similar students who did not use it. Moderate evidence that the program is positively associated with the outcome, but not proof of cause.
What we can say: Students who used the program performed better on the outcome measure than comparable students who did not use it.
Correlational | Promising Evidence
Research meeting ESSA Tier 3. The study examines the relationship between program use and outcomes of interest, without a comparison group, while controlling for selection bias using statistical methods. This bias refers to the possibility that schools and educators who used the program differed from those who didn’t in ways that could explain the results independently.
What we can say: Use of the program was positively associated with the outcome measure.
Research-Based Design | Demonstrates a Rationale
Research meeting ESSA Tier 4. A documented logic model grounded in existing research, with a study underway. The logic model describes how a program is designed to work and why, but does not include study findings. It provides a rationale, or theory of action, for why a program could work.
What we can say: This is built on established research, and here’s why we think it would work. We will test our assumptions in forthcoming studies that provide promising, moderate, or strong evidence.
Psychometric Research | Assessment Quality
Our psychometric studies ask whether assessment scores support valid, reliable, and fair interpretations of students’ academic achievement, enabling educators to make appropriate educational decisions for all students. They are guided by the APA/AERA/NCME Standards for Educational and Psychological Testing and national reviews, such as those from the National Center on Intensive Intervention (NCII).
What we can say: The assessment measures what it claims to measure, consistently and fairly across student groups, and is suitable for the decisions educators make with it.
Descriptive | Observed Patterns
Research that examines patterns across large groups of students. These studies may describe school or district observations about what seems to work for their students, or describe how the product is used in a particular context. Generally, this type of research does not use statistical controls but may report assessment outcomes for various groups of students.
What we can say: This is the pattern researchers found.
Customer-Reported | District-Measured Outcomes
Outcomes districts measured and reported themselves, from named partners. We publish these because district leaders want to know what peers achieved, and we hold them to a standard: a defined, quantified outcome, a stated timeframe, and a named leader on the record.
What we can say: This district achieved this, reported it, and put its name to it.
Our Approach | Stated Intent
Commitments, design principles, safeguards, and capabilities we have built are measured against a standard we publish. It describes how our programs are designed and what we hold ourselves accountable for. View our full commitments, including what we promise and how districts can hold us to it.
What we can say: This is what we believe, what we built, and the bar we set for ourselves. In some cases, we have not yet measured its effect.
Go Deeper: Efficacy Research Psychometric Research Foundational Research State and Agency Approvals Our Commitments
See what this evidence means for your district
Connect with our team to learn how research-backed solutions can support your district’s priorities.


